


In the first two parts of my series “Why IT teams should be using JupiterOne,” I focused on the immense value of leveraging JupiterOne for deploying (and monitoring) EDR and Patch Management solutions. IT teams do far more than manage software distributions to endpoints, so for this article I want to shift gears a bit and focus on another primary function IT is better known for: Help Desk Support.
IT service management through the JupiterOne lens
IT service management (ITSM) tools, whether it’s for your internal support (corporate) or external support (customers), have evolved to the point where leveraging integrations and addons for capturing reporting metrics has become common practice. These ‘value adds’ are often hidden behind a paywall, and if you’re using Jira as your ITSM there are hundreds of Jira apps available to enhance your reporting game. With this in mind, I took the ‘shoestring budget’ approach to capture Help Desk SLA trends using the Jira integration for JupiterOne.
Accountability begins with transparency
An established Service Level Agreement (SLA) for your support team does not guarantee, nor does it provide a measure of success, if your Jira data isn’t readily available at a moment’s notice. If your team is experiencing a continuous increase in ticket submissions, your number of SLA violations will start to trend the wrong way. This growing problem will fester as some folks will be inclined to rush through requests only to have those closed cases reopened. The ramifications of a growing backlog in Jira with low visibility can be disastrous, so let’s look at a way to leverage JupiterOne as a tool for accountability through transparency.
Our goal is to create an intuitive graph that tracks SLA misses for each priority level in JupiterOne and to have it so that it’s readily available at a moment’s notice.
Know your data points
We will leverage a few Jira property fields to identify how many issues in our Help Desk queue are in violation of our SLA by leveraging the following data properties:
- key: DESK (our test project key)
The unique key for your Jira Project. You can find this from the URL of your company’s Jira instance (e.g. acme.attlasian.net/jira/…./DESK/boards/). The key can also be found in the project board itself at the top of the page.
- priority: Critical - Tier 1, High - Tier 2, Medium - Tier 3, Low - Tier 4
Jira has five default priority labels, so depending on how your priority fields are configured in your company’s Jira instance it’s best to use your value names (e.g. Lowest, Low, Medium, High, Highest).
- issueType: Access Change Request, Facilities Request, IT Request, Security Incident
The default Jira issue types are Story, Epic, Task, Sub-Task, etc. Issue types can be configured by a Jira Administrator.
- status: Open, On Hold, In Progress, Done, Closed, etc.
To simplify our approach for measuring SLA violations we will be using the “Done” and “Closed” status options. The “Closed” status phase usually appears for issues that have a resolution screen tied to a workflow if your Jira Administrator has set one up.
- createdOn: Actual time stamp for when the issue was created.
Jira uses the epoch time format, so for simplicity I will measure SLA timelines by days.
With these three basic data points we can now begin working on our J1QL query. For demonstration purposes I will use made up data values next to each data point.
In building this query, I stuck to the data points I mentioned above while utilizing the date.now function to calculate the age of the defined issueTypes, and set seven (7) days as the threshold for when an issue should be considered an SLA violation. That’s more than enough to create a saved question with daily trend data collection enabled, but I want to simplify the data table results with two distinct properties: The ticket number and who it was assigned to.
What if I want to capture every issue type?
In this scenario, you can leave out the issueType from the query to simplify your task.
Saving questions
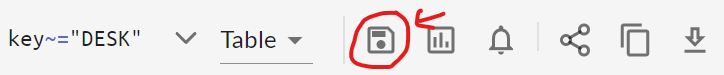
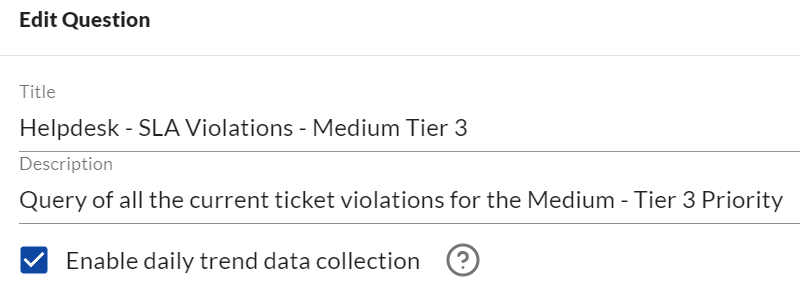
Happy with the results, I clicked the “Save as Question” button, and named it “Helpdesk - SLA Violations - Medium Tier 3.” I still need a query for the other priority levels; this can be done by copying the query I just created, updating the priority value and the date.now value, and saving that question with the daily trend data collection enabled as demonstrated in the screenshot below.
End result - SLA Violation trends
The great thing about saved questions is that you can enter the question name into the J1QL text field at any time to view SLA Violation trends, and focus on reducing your SLA misses through action.
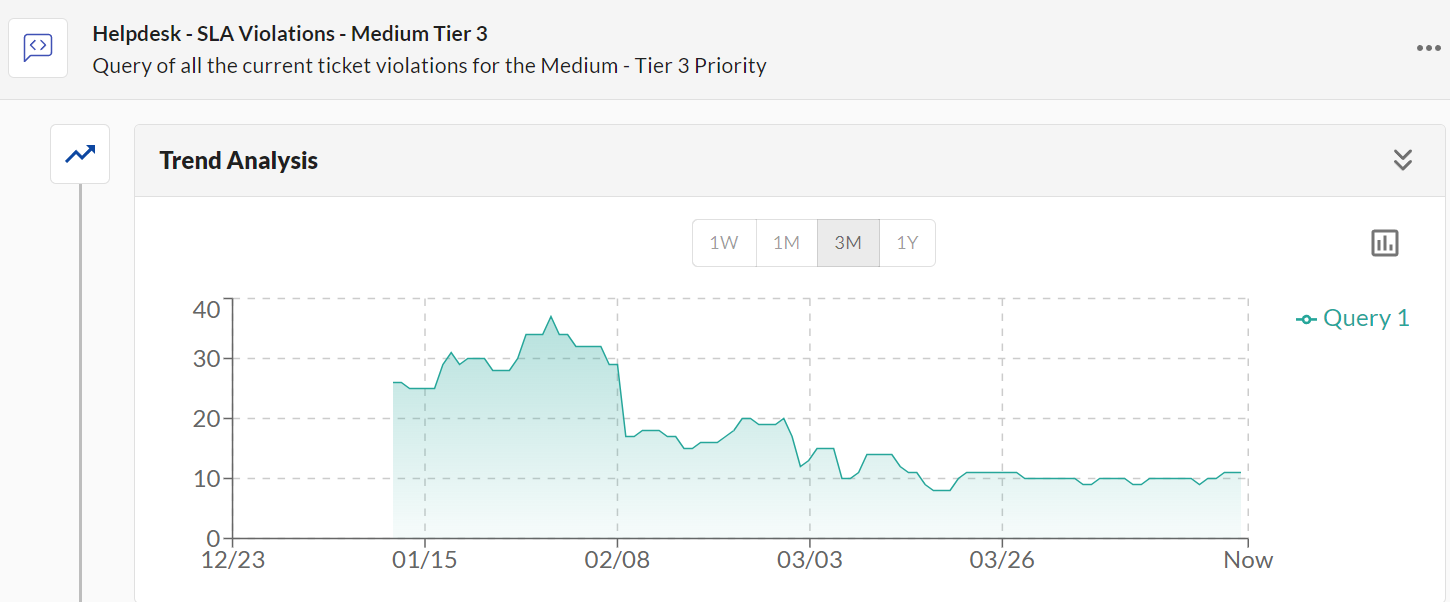
The sample graph demonstrates improved overall progress within the first few weeks of having this data accessible to stakeholders within the Help Desk team. During the second month we noticed gradual improvements, and by the third month the SLA Violations have remained consistent around the 10 ticket mark.
Analyzing SLA data points
The Trend Analysis for Helpdesk - SLA Violations - Medium Tier 3 on the surface shows improvement (“Yay!”), yet without knowing more about other contributing factors, such as ticket volumes and personnel availability, the data lacks a little depth.
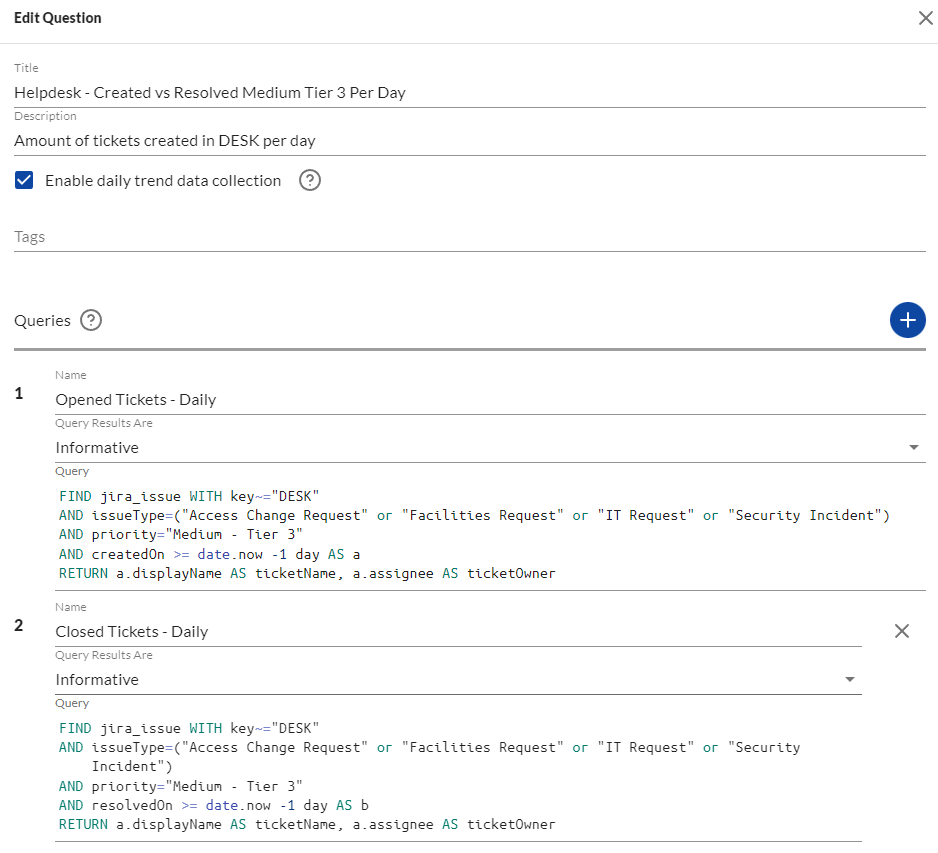
One way to complement this issue is to set up another saved question that captures all incoming tickets within a 24 hour period by using the following J1QL inquiry:
The only change here is the removal of the priority data point in the fields that are RETURNed, and a time adjustment for the createdOn property. This can be saved as a question with daily trend data collection enabled, but before doing so let’s add a second query to also calculate how many tickets were closed on the same day. For this we will leverage the resolvedOn data point instead of the createdOn and build our query as follows:
The two queries combined into one question will provide teams with better visibility over incoming ticket volume totals when compared to those closed on the same day. Low volume days are perfect opportunities to play catch up with backlogged tickets. This is a repeatable question to cover all of your priority levels, so unless your SLAs get updated there’s no need to revisit this query to make constant tweaks!
Benefitting from greater visibility
There are several approaches to optimize visibility into your Help Desk team’s ticket performance, and this data should be used to empower your staff through proactive, transparent awareness. Even as I wrap up this blog post, I too have learned a few neat tricks that helped improve my existing Insights Dashboards, J1 Questions, and overall status reports to leadership.


.png)

